Table of Contents
Why Do You Need an Innovation Radar?
What should be at the top of your innovation agenda?
How do you prioritise what to build or invest in among all the promising opportunities?
Why is it important that the Innovation Radar is constantly updated with live information, vs. a point-in-time activity?
Learn how to enhance your scouting and prioritisation methods with an Innovation tool powered by real-time information and workflows.
How to Build Your Innovation Radar in 5 Simple Steps
You can use this methodology to monitor technological advancements that create innovation opportunities and select those that are better aligned with your goals and expertise.
Bonus: you can automate repetitive steps and time-consuming parts of this workflow with no-code tools like zapier1 or use Machine Learning and NLP.

Define your Scope and Scouting Universe
Identify the goals of your Innovation Radar. Are you focusing on industry-specific innovations, new technologies, market trends, or competitors?
Define your thesis clearly so that you can collect the right datasets and get better results identifying clusters of opportunity.
Get Outside-in Perspective and Scan Adjacent Industries for Tech Transfer
From experience, I suggest expanding your universe to adjacent industries to benefit from potential technology transfer.
In the automotive industry, for example, many innovations for sustainability come from Agriculture or the Food and Beverage industries where materials’ circularity could have a high Technology Readiness Level.
Alternatives to natural leather for car seats could come from the Fashion (e.g. handbags) or Food and Beverage industries (alternatives to plastic bottles).
Your Data
Internal and External Data
- Internal Data Sources: Use insights from R&D, sales, customer feedback, and other internal units.
- External Data Sources: Leverage industry reports, news sites, technology publications, market intelligence platforms, and social media feeds.
Data quality is one of the most important parameters in identifying advancements, trends and opportunities
Structured & Unstructured
I recommend using both structured and unstructured data. Your structured data should cover innovation metrics, such as patent filings and scientific literature, start-up funding, investments, annual component sales and regulation.
Use unstructured data such as market research reports, news and interviews with industry experts.
Free sources for innovation data include Google patents, lens.org,2 or Questel.3
Set up Live Data Feeds
Many innovation teams still use static reports to develop their Innovation Radar. But the speed of technological advancements is so high that you might miss out on opportunities.
A good practice would be to set up live feeds and gateways into your Innovation process to revisit your findings and assess changes.
Here are a few examples of live data feeds.
- APIs from data providers, such as the WIPO for patent data.
- Web Scraping Tools (e.g., Python with Beautiful Soup, Scrapy): To help you collect data from websites and news sources.
- Machine Learning
- Market Intelligence Platforms: To monitor startups, emerging technologies, and trends.
- Social Listening Tools (e.g., Brandwatch, Mention) capture discussions on innovations.
- RSS Feed Readers (e.g., Feedly): To keep up with news and articles.
Create a Knowledge Database
That’s a more advanced step but, very important in my opinion, because you can leverage workflow automation and Generative AI to chat with the data.
I’ll do a separate post on this one soon.
Approaches to Innovation Scouting
There are different approaches to innovation scouting, such as the “Horizon Scanning4“ model (e.g., short-term, mid-term, and long-term innovations).
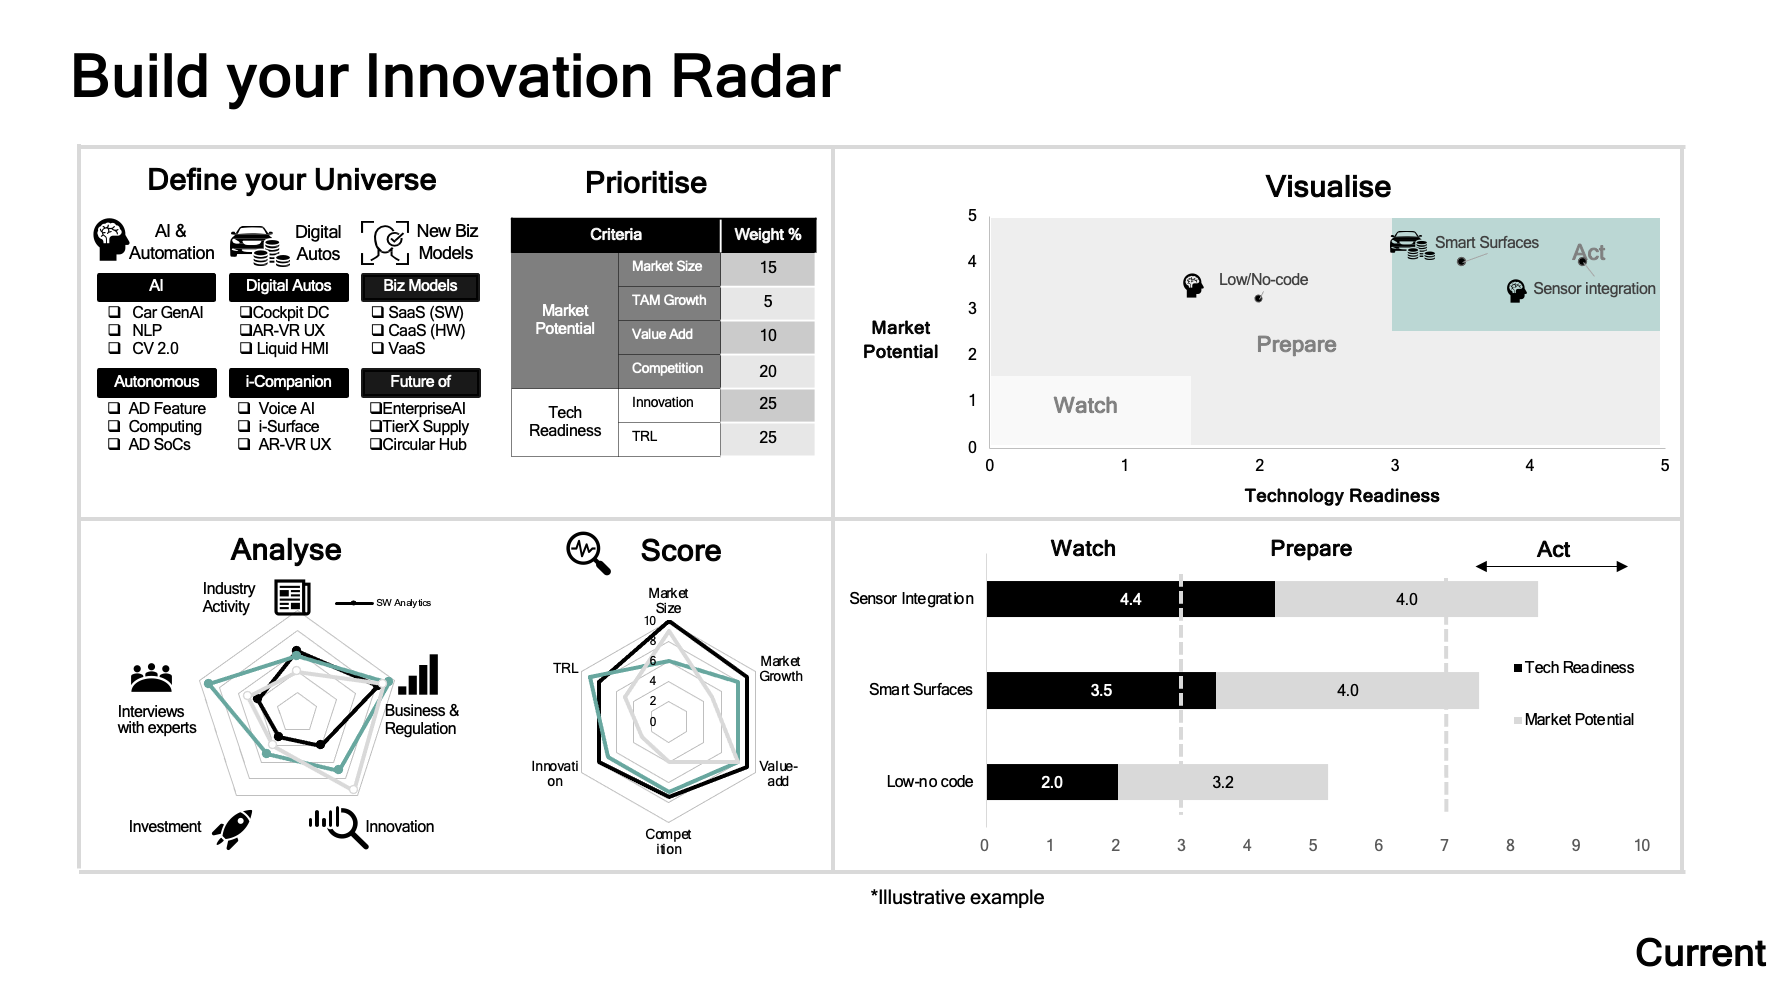
In this example, I compare the Market Potential vs. Technology Readiness and Market Readiness to categorize and evaluate the impact and relevance of each innovation.
Look for innovation opportunities that not only add a lot of value, but have a high addressable market, strong growth, low competition and technological readiness (TRL) is aligned to your goal (e.g. short or long term.)
For each of the three parameters, define sub-parameters and weights, such as the following.
For example, Market Potential could be a function of the TAM (Total Addressable Market), Growth (CAGR TAM), and Competition.
- Understand unmet needs and Pain points. This means, identifying inefficiencies and how they could be improved.
- Conduct PESTEL5 analysis to identify trends and prepare the scenario-building;
- Categorise news into product innovation, technology advancements etc. and calculate their TAM and growth.
- Measure the Innovation Intensity, Growth, TRL of patents and scientific literature
- Synthesize the findings to build alternative scenarios of market adoption and potential disruption.
Prioritize Opportunities With Quantitative Methods
Score the opportunities by Market Potential (e.g. TAM) vs. Technology Readiness (e.g. TRL) and Market Readiness with the weights of your choice. This could be a simple formula of allocating weights to the parameters to calculate the total score.
The opportunities with the highest total score should be the ones to “Act” on, whereas the others could be part of your Prepare or Watch.
Assess the selected item(s), i.e., their alignment with your goals, the investment required, and the strategic fit.
Develop a System for Continuous Updates
Innovations evolve; create a system for continuous monitoring and updates.
Integrate feedback loops from users and stakeholders to refine and adapt the radar over time.
For the Prepare and Watch, you can set up Trigger Points, i.e. get notified when milestones are reached to trigger Action.
Bonus: Dynamic data flows continuously update the scoring based on trigger points to help you react faster and make more informed decisions.
Visualise Your Innovation Radar with Live Dashboards
Create visualisation Dashboards for your Innovation Radar with tools like Miro, Lucidchart, or Power BI. Radar Charts and Bubble Maps are also common ways to represent data visually.
Measure and Evaluate Performance
Track the Innovation Radar’s effectiveness using KPIs such as adoption rates of identified innovations, R&D success metrics, or cost savings achieved.
That’s a wrap! I hope you found this useful.
PS: Check Current if you struggle to put this together or want to see the innovation radar I’ve built to scout for automotive business cases.

